Real world domains often contain plenty of data with complex and structured relationships among attributes, which cannot directly be represented in a single table, without losing the information of relationships among attributes. Graph has become the most natural representation of such data due to the fact that attributes could be represented as nodes of a graph while the relations between attributes could be interpreted as edges of the graph. This representation minimizes the loss of information due to transformation of complex data into graphs. Data such as free text, images, bitmap objects, relational databases etc, are usually extracted (or processed) by graphs as-is basis, allowing a better visualization of the attributes and their relations. Data that could be found in repositories of chemical data, computational biological data, social networks, web data and links, XML data, image data including handwritten documents, and many more, could therefore be treated as graph data, or data that could be transformed into graphs. Given below are two examples of graph data picked up from two different data repositories.
Example 1: Web data
With the emergence of HTML 5 and other modern markup languages and tools such as Google snippets, which provides rich structural formats, the World Wide Web is not a collection of documents any more, but a collection of graphs that could be used to learn important information on the user interests, click streams, popularity of certain web sites/pages etc. Web data is accumulating by a factor of trillions of bytes day by day, and the challenges encountered in handling, processing and interpreting the data from the World Wide Web are thereby getting increased. Figure 1 given below is an example of a structured data element from the web domain that represents a web traversal session of a student, where the web pages have their own set of attributes, and relations among web pages.
Figure 1: An example from web data
Example 2: Chemical data
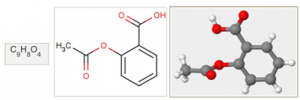
A typical chemical dataset consists of compounds, which could be used for modeling the relationship between the chemical structure of compounds and their effects, such as solubility, permeability, protein binding, mutagenicity, carcinogenicity, metabolic stability and so on. Learning such relations is of high importance in processes such as drug discovery. Virtual (in silico) screening for potential issues early on in the drug discovery process helps researchers to decide whether or not the compounds should be synthesized and tested in laboratories (in vitro), something which is both expensive and time-consuming. Highly accurate computational models that could correctly identify successful leads are hence gained an increased attention in the Chemoinformatics field. The natural representation of a chemical compound could either be in 1 dimensional, 2 dimensional or 3 dimensional forms, as shown in the example below.
Figure 2: The Aspirin molecule in its 1D, 2D and 3D representation
Chemical compounds are encoded in many ways, such as fingerprints, as a set of global properties of molecules, such as their weight, number of atoms and bonds, various atomic measures, number of pre-identified substructures, e.g., carbons rings, etc. Nevertheless, encoding of compounds at an atomic level, where the atoms and bonds are represented in a 2- dimensional structure, which is known as chemical graphs, are found abundant in chemical data repositories.

